
در پست رایتینگ تسک ۱ آکادمیک آیلتس #17 شما را با یک نمونه از رایتینگ های تسک 1 آشنا می سازیم.
Write a report for a university lecturer describing the information below.
You should write at least 150 words.
You should spend about 20 minutes on this task.
Model Answer:
The graphs show health and education spending and changes in life expectancy and infant mortality in the UAE. Overall, as the percentage spent on health and education increases, infant mortality and life expectancy improve.
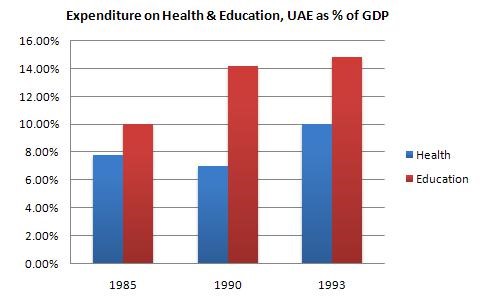
Graph 1 shows the percentage of GDP spent on health and education between 1985 and 1993. There were big increases in both areas. Health spending stood at about 8% in 1985 but rose to 9% in 1990 and 10% in 1993. Spending on education was even higher. It was 10% in 1985, and shot up to 14% in 1990 and 15% in 1993, a 50% increase in just 8 years.
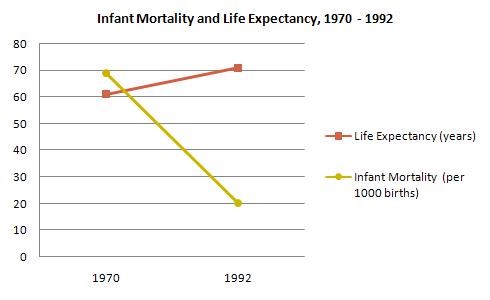
Graph 2 shows improvements in life expectancy and infant mortality between 1970 and 1992. Life expectancy was just 60 in 1970 but rose to almost 72 in 1992. In contrast, the number of babies dying dropped dramatically, from 60 per 1000 in 1970 to only 22 in 1992.
In conclusion, people in the UAE are living longer and healthier lives because of the government’s spending on education and medical facilities.
امیدواریم که از پست رایتینگ تسک ۱ آکادمیک آیلتس #17 استفاده کرده باشید، همچنین برای آمادگی بیشتر توصیه میکنیم از کارگاه رایتینگ آیلتس ما دیدن فرمایید.
همچنین برای تهیه ی کتاب های آموزشی زبان انگلیسی می توانید به سایت فرتاب مراجعه فرمایید.