
در پست رایتینگ تسک ۱ آکادمیک آیلتس #2 شما را با یک نمونه از رایتینگ های تسک 1 آشنا می سازیم.
Writing Task 1 Academic رایتینگ تسک ۱ آکادمیک
You should spend about 20 minutes on this task.
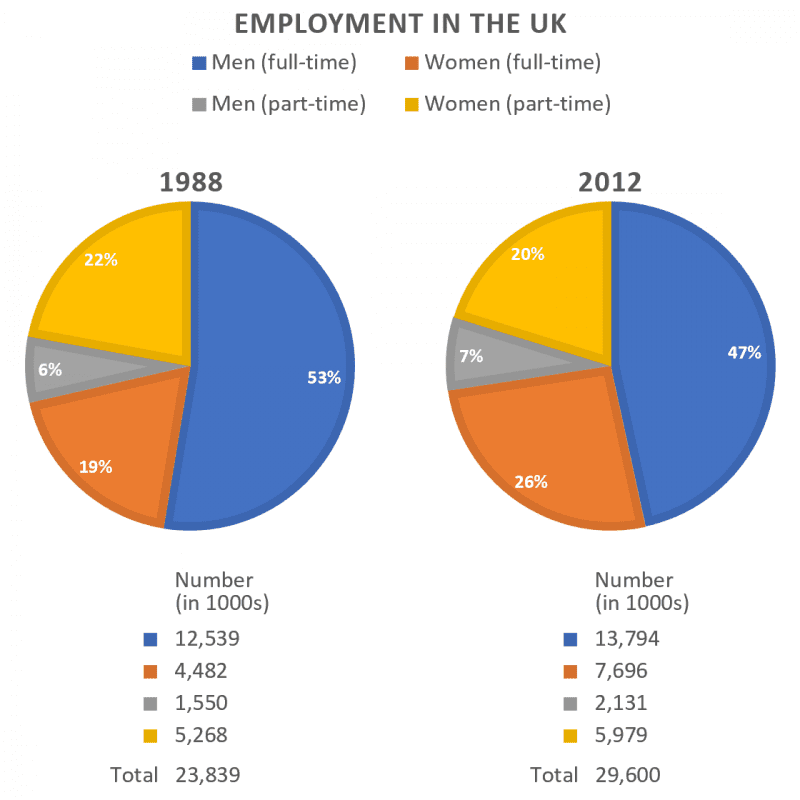
The charts give information about employment in the UK in 1998 and 2012.
Summarise the information by selecting and reporting the main features, and make comparisons where relevant.
Write at least 150 words.
Model answer
The pie charts show the numbers and percentages of men and women in both full-time and part-time employment in the UK in 1988 and 2012. Overall, we can see that all numbers increased but there were significant differences in the proportions for each year.
Firstly, although the number of men in full-time employment was largest in both years, the greatest change was in the number of women working full-time. This increased from 4,482,000 in 1988 to 7,696,000 in 2012. These changes can be seen in the percentages of the total workforce; in 1988, women in full-time employment made up only 19% of working people, but this increased to 26% in 2012. As well as the number of people working full-time, the number of people working part-time also increased, with women being the largest number in both years: 5,268,000 and 5,979,000, compared with 1,550,000 and 2,131,000 for men.
In conclusion, apart from female full-time employment and male part-time employment, percentage figures decreased between the two years. Most significantly, men working full-time dropped below 50% to 47% in 2012.
(177 words)
امیدواریم که از پست رایتینگ تسک ۱ آکادمیک آیلتس #2 استفاده کرده باشید، همچنین برای آمادگی بیشتر توصیه میکنیم از کارگاه رایتینگ آیلتس ما دیدن فرمایید.
همچنین برای تهیه ی کتاب های آموزشی زبان انگلیسی می توانید به سایت فرتاب مراجعه فرمایید.