
در پست رایتینگ تسک ۱ آکادمیک آیلتس #3 شما را با یک نمونه از رایتینگ های تسک 1 آشنا می سازیم.
You should spend about 20 minutes on this task.
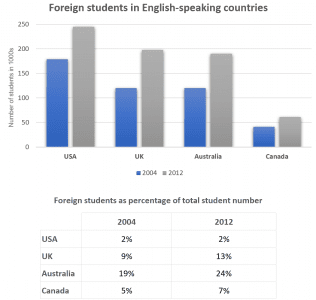
The bar chart and table show information about students from abroad studying in four English-speaking countries in 2004 and 2012.
Summarise the information by selecting and reporting the main features, and make comparisons where relevant.
Write at least 150 words.
Model answer
The bar chart shows the number of foreign students studying in four English-speaking countries in the years 2004 and 2012, while the table shows foreign students as a percentage of total student numbers in the countries. We can see that the overall trend is an increase in both the number and percentage of international students in most countries.
Starting with the number of students, the USA had the most foreign students, rising from approximately 179,000 in 2004 to around 245,000 in 2012. The figures for Australia and the UK were similar, increasing from around 120,000 to almost 200,000. Canada had a significantly lower number of overseas students than the other countries, with about 41,000 in 2004 and approximately 61,000 in 2012.
Next, if we look at the percentage of foreign students, we can see that percentages increased for all countries, with the exception of the USA. The percentage of foreign students was highest in Australia at 24% of total student numbers in 2012. In the USA, the percentage of foreign students remained stable at 2%, which was the lowest percentage of all four countries.
(195 words)
امیدواریم که از پست رایتینگ تسک ۱ آکادمیک آیلتس #3 استفاده کرده باشید، همچنین برای آمادگی بیشتر توصیه میکنیم از کارگاه رایتینگ آیلتس ما دیدن فرمایید.
همچنین برای تهیه ی کتاب های آموزشی زبان انگلیسی می توانید به سایت فرتاب مراجعه فرمایید.